So far, when discussing the various frequency components of a signal — i.e. the sine waves that together make up the signal — I’ve mostly focused on the amplitude of these sine waves. In order to keep things simple and short, I’ve been purposefully evading the subject of phase, an often-overlooked property of waveforms. Now it’s time to face the music (pun intended) and fill this gap, as this concept will be useful in future posts.
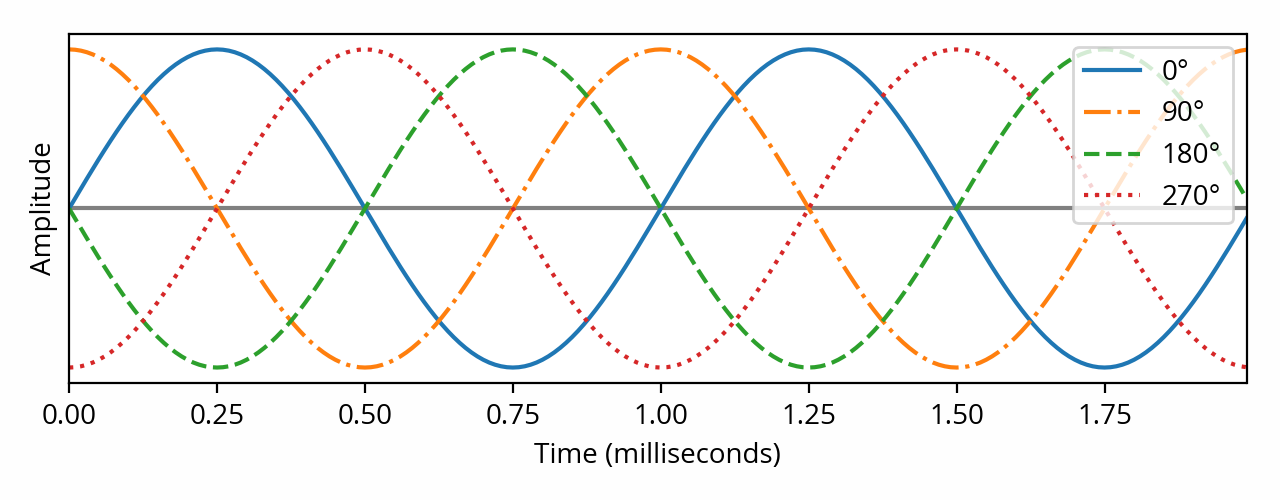
The above plot shows four different sine waves. Contrary to what I’ve discussed previously on this blog, these waves don’t differ in frequency nor amplitude. Instead, their cycles are offset from each other in time. In other words, they have different phase.
Phase indicates what part of the wave cycle is occurring at a given point in time. When not specified, that moment is conventionally defined as the origin of time (i.e. t=0). For example, in the above plot, the phase of the solid blue sine wave is zero, because its cycle starts at the origin. In contrast, at the same instant, the other sine waves are at a quarter, a half, and three quarters of their cycles, respectively.
When a sine wave reaches the end of its cycle, it’s right back when it started and a new cycle begins again. In that way, progressing through the cycles of a sine wave is a bit like running around in circles. Hence it is no surprise that the terminology used when reasoning about phase is that of turns and angles. It seems natural in that context to define a full cycle as 360 degrees — or, alternatively, 2π radians — and from there, the other sine waves shown above could be defined as fractions of a full cycle: 90° (½π rad), 180° (π rad) and 270° (³⁄₂π rad). [note] From a mathematical perspective, the analogy goes much farther than this. These concepts are all variations on the same common theme. [end note]
Phase in the frequency domain
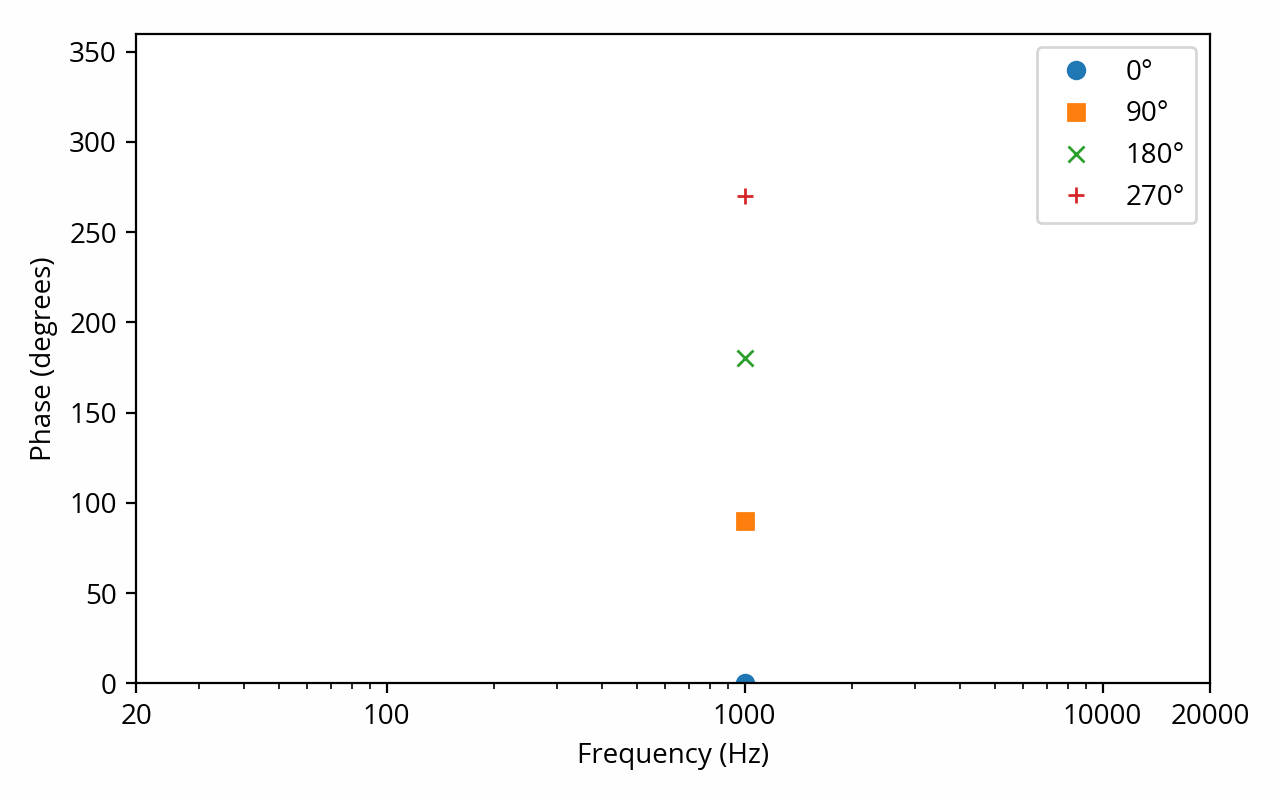
We’ve seen previously that the Fourier transform can be used to decompose any signal into a number of constituent sine waves — one per discrete frequency. In addition to the amplitude of each sine wave, the output of the Fourier transform (i.e. the spectrum) also contains their phase. For example, here is the phase information that the Fourier transform produces for each of the four above signals: [note] For the sake of consistency and to avoid confusion, I cheated a bit here — the real components of the Fourier transform are cosines, not sines, so strictly speaking the output should be offset by 90°. This is purely arbitrary and doesn’t matter one bit, though. [end note]
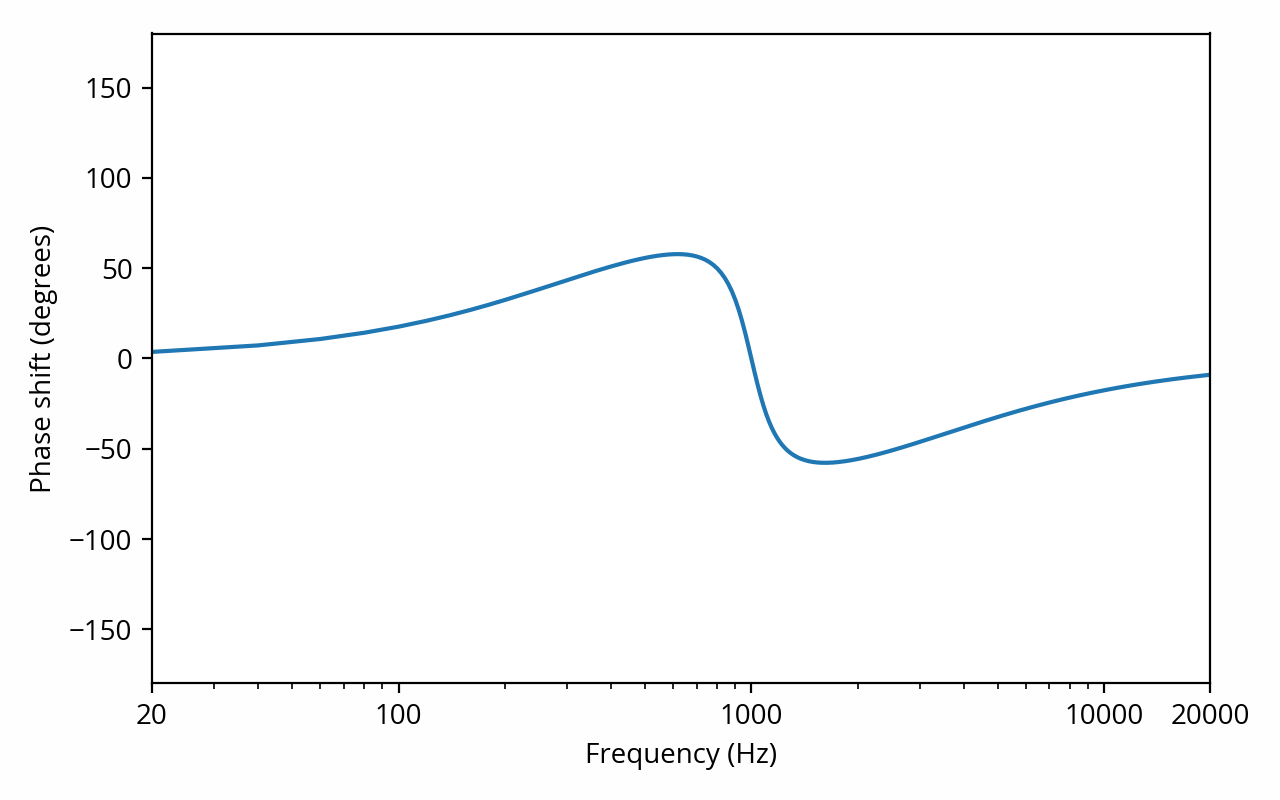
We’ve also seen previously that a linear system can alter the amplitude of the frequency components that flow through it. In the same way, a linear system can also alter their phase (which is not the same thing as delaying them — see below), and the extent of these alterations can be shown on a plot, called the phase response. Here is the phase response of a system that is similar to the example from that previous post:
Phase and delay
The sine waves I’m using as examples have a frequency of 1 kHz, which means that a cycle completes in 1 millisecond. From that perspective, it is tempting to think about phase as a time offset; for example, one might say that a 1 kHz wave with a phase of 90° is offset by one quarter of a millisecond relative to the reference. This quantity is known as the phase delay.
This is where things get tricky and misleading, though. One subtlety that is often overlooked when dealing with such concepts is that, mathematically speaking, phase is a property of a periodic signal, which implies a continuous wave of infinite duration with no beginning and no end. Real-world signals of course do not meet these criteria. For most intents and purposes this does not really matter, but in some cases it does, and this is one of those. Specifically, it makes it very easy to misinterpret the meaning of phase delay.
Imagine that, in the above plot, the sine waves went on forever on both sides of the figure. What does “delay” even mean in that context? I could say that the 90° wave is delayed by 0.25 ms relative to the 0° wave, but I could just as well flip things around and say that the 0° wave is delayed by 0.75 ms relative to the 90° wave. Since both signals extend infinitely to the left, it makes no sense to imply that one started before the other. I could even go one step further and say that the 90° wave is delayed by, say, 10.25 ms (10 full cycles, plus a quarter cycle) and it would still mean the same thing. For this reason, the word “delay” needs to be handled very carefully in this context. [note] For an illustration of what can happen when people get confused about these concepts, see this epic trainwreck of a debate where 46 participants spend 456 posts fighting to the death over the deep philosophical meaning of the word “delay”. The math is easy; it’s interpreting the results that’s hard. [end note] Following the same logic, in terms of the phase itself, 90° is equivalent to -270°, 450°, -630°, etc. [note] In fact, when using complex numbers to do signal analysis, these are not just equivalent: they are the exact same number, landing in the same spot on the complex plane. [end note] [note] You might come across phase response plots where the range of values exceed 360°. This is called unwrapped phase and is meant mostly as a visual aid, making the graph more readable by avoiding sudden jumps at the boundaries of the range, and making some calculations easier. The underlying data is the same. [end note]
Then again, one might still be tempted to argue that this is a mostly theoretical distinction: after all, any real-world device that changes the phase of the signal that passes through it has to apply some kind of delay, right?
Well, not necessarily. As a counter-example, consider the case of a very basic device that reverts the polarity of the signal in the analog realm. In other words, it changes the sign of the voltage, which could be as simple as swapping two wires. The opposite of a sine wave is that same sine wave shifted by 180°, so in effect, this device shifts the phase of every frequency component of the input signal by 180°. One can even say that it has a phase delay of 0.5 ms at 1 kHz (and 1 ms at 500 Hz, and 0.25 ms at 2 kHz, and so on). Yet it would be impossible to say that this device delays the signal for any reasonable definition of “delay” (i.e. in terms of information or energy propagation). It physically can’t, since there is no memory (buffer) for it to hold the signal in, and energy is coming out as soon as it gets in. This device exhibits phase shift and thus phase delay, yet there is no actual delay.
For these reasons, in general, it is not possible to know the true delay of a device by making a single phase shift measurement at a single frequency. [note] A pure delay produces a phase shift at every frequency equal to frequency times delay — which, incidentally, is very effective at making a mess in phase response plots. But delay cannot be directly recovered from the phase shift at a single frequency, because, as explained above, there is loss of information — the phase shift is constrained to a 360° range, making its interpretation ambiguous. [end note] It is, however, often possible to get more information about delay if a number of phase shift measurements are taken at various frequencies, such as by looking at a phase response plot like the one from the previous section. More specifically, this can be used to compute the group delay of the device, albeit with a number of caveats related to measurement accuracy. Some devices, especially those that exhibit amplitude frequency response distortion like the above example, have a group delay that itself varies with frequency, which makes interpretation even trickier. [note] If you’re not convinced how tricky this is, consider that the example I’ve used above (which is quite mundane, really) has negative group delay in the low frequencies. Let that sink in for a moment. That doesn’t seem physically possible, but it is. [end note]