In the last series of posts I’ve been focusing on the concept of amplitude, first defining it as the strength of an audio signal, then describing its physical manifestations as the signal makes its way through the audio playback chain, and lastly explaining how decibels are used as a way to manipulate these numbers.
The attentive reader might have observed that, back in that very first post, I deliberately left out an important part for later. The issue that still needs to be addressed is exactly how to quantify amplitude, i.e. how do we calculate its value for a given audio signal. Let’s go back to our original example of a pure tone (sine) waveform, but with a vertical scale this time:
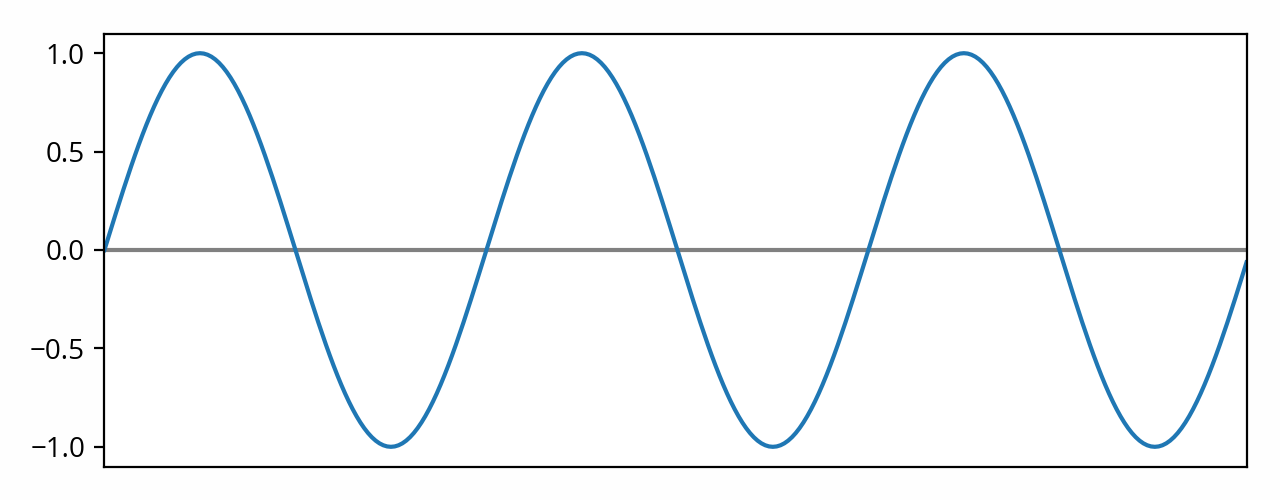
Now let me ask you a question: what is the amplitude of that signal?
Peak amplitude
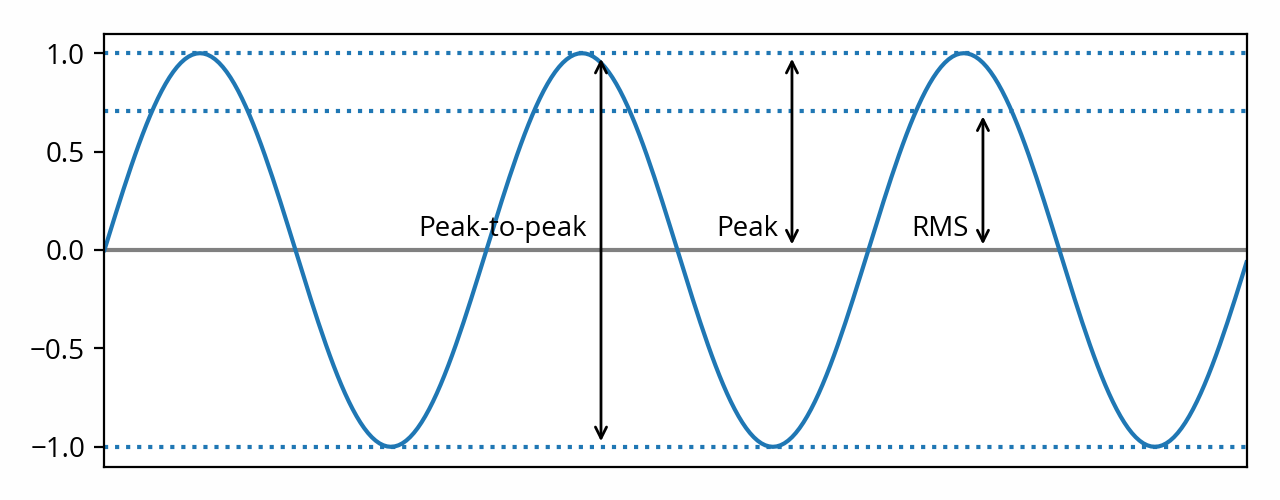
You might be tempted to answer that question with “1.0” [note] Well, unless you are an audio engineer and you know what’s up. But in that case, what are you doing here? [end note] , because that’s the as far as the curve travels from its middle point. Or perhaps you might answer “2.0”, because that’s the total height of the waveform (-1.0 to 1.0).
These are not the only possible answers (as we’ll see below), but they are valid answers nonetheless. The former answer (“1.0”) is called the peak amplitude of the signal. The latter answer (“2.0”) is called the peak-to-peak amplitude of the signal.
Peak-to-peak amplitude is twice the peak amplitude. [note] Strictly speaking that’s a bit of an oversimplification, because it assumes that audio signals are symmetrical, but they often aren’t — see Hetrich, Wayne L., “Real-World Audio Wave Form Asymmetries and the Effect on the Audio Chain”, presented at the 55th AES Convention, New York, NY, USA, preprint 1193, (October 1976). However this rarely matters in practice. [end note] In practice peak amplitude is more widely used than peak-to-peak amplitude. [note] One notable exception is marketing material (including manufacturer-provided specifications), where peak-to-peak amplitude is often used because the number looks bigger — don’t be fooled! [end note]
The problem with peak amplitude
You might be wondering why we can’t simply stop there. After all, we just came up with a quantitative definition of amplitude, so our job here is done, right?
Not so fast. Let’s not forget that amplitude is used in a variety of contexts for a variety of calculations and comparisons. We need to make sure that the definition we came up with (peak amplitude) is appropriate for what we’re going to use it for.
Peak amplitude is appropriate in some contexts. For example, if you’re trying to determine whether a digital signal is going to clip, peak amplitude is definitely the metric you should use to make that determination. But in most cases, what we’re most interested in is the amount of energy that is being conveyed in that audio signal on average. [note] “Energy” is used here in a generic sense, as physically speaking there is no “energy” in a digital signal for example. However it does map directly to the physical definition of energy when the signal enters the analog or acoustic realms, and since the acoustic realm is really all that matters in the end, it makes sense to use that term to describe audio signals in general. [end note] Peak amplitude fares poorly in that scenario. To understand why, let’s look at an extreme example of a signal that is very different from a sine wave:
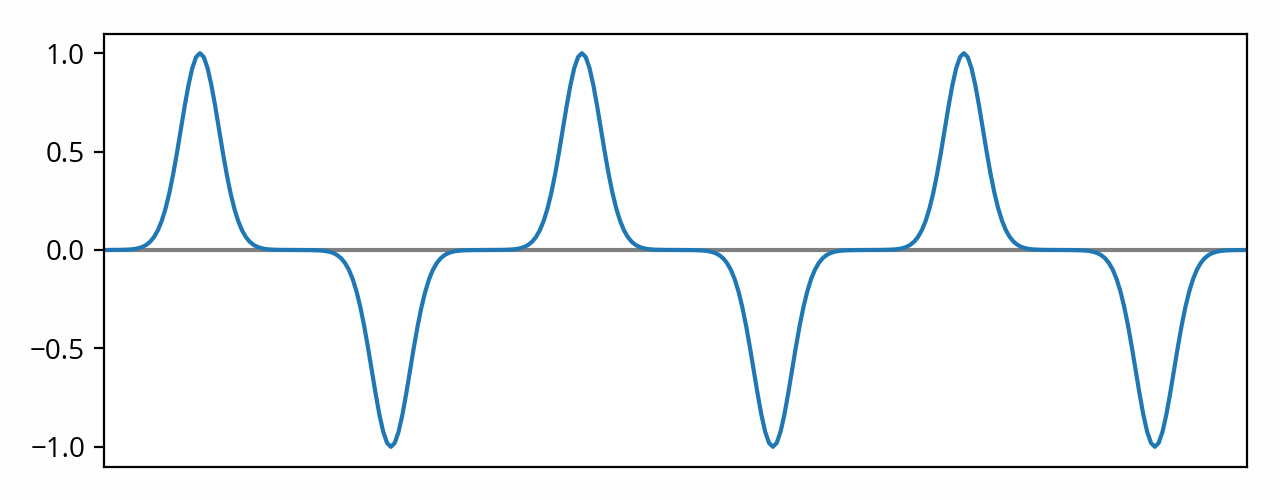
That signal has the same peak amplitude as the previous example. Yet, it’s easy to see that it conveys less energy: it’s mostly silence only interrupted by a train of narrow peaks. That makes peak amplitude ill-suited for estimating the overall strength of the signal.
RMS to the rescue
To solve this problem, we need a different metric. Ideally, we want to compute some kind of average of the signal. We can’t use the mean — that would just amount to zero, since the positive and negative parts of the signal would cancel each other out.
As it turns out, there is a standard way to compute the average value of an audio signal (or any alternative signal for that matter): the root mean square (RMS). It’s a simple formula: we square the signal values, sum the squares, divide the result by the number of values, and then finally we take the square root of that number. [note] For the sake of example, I’m assuming a discrete-time signal here. [end note] Because the values are squared, the positive and negative parts of the signal add up instead of canceling each other. [note] This discussion assumes that the signal is centered on zero — i.e. that there is no DC offset. In audio this is almost always a safe assumption to make. Incidentally, RMS when used in this context is the same thing as standard deviation. [end note]
If we apply that formula to the first example, we end up with ~0.707. More generally, for a pure sine wave (and only for a pure sine wave!), the math tells us RMS amplitude is equal to peak amplitude divided by the square root of two (√2). Or, when working in decibels, that’s peak amplitude minus ~3 dB.
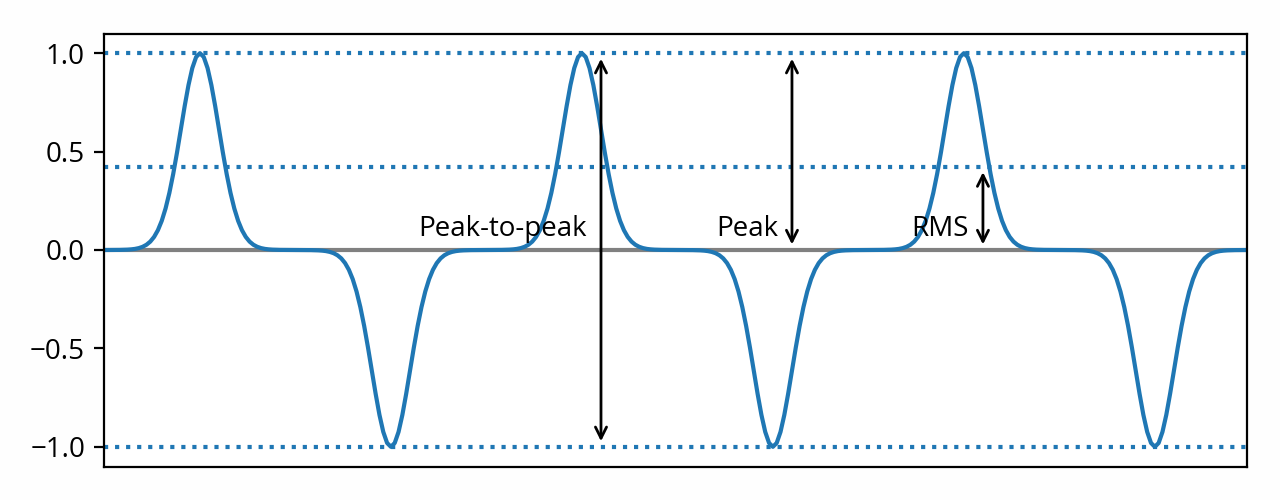
When applied to the second example, we end up with ~0.424. As expected, we get a lower value as the signal conveys less energy. In other words, the ratio of peak amplitude to RMS amplitude — known as the crest factor [note] Sometimes informally — and somewhat incorrectly — referred to as dynamic range in some contexts. [end note] — is different because the shape of the waveform is different.
Closing thoughts
We’ve seen that there is more than one way to quantify the amplitude of a signal, and that different approaches will produce different results depending on the shape of the waveform. Depending on the context in which the numbers are used, some approaches might be more appropriate than others.
In practice, the method used to calculate the amplitude is often stated near the unit. For example, “Vrms”, “Vp”, “Vpp”. Otherwise, it is often assumed that RMS was used. In particular, levels expressed in decibels (e.g. “dBV”), are virtually always RMS [ref] IEC 60027–3:2002, Letter symbols to be used in electrical technology — Part 3: Logarithmic and related quantities, and their units, §4.1 [end ref] (with the possible exception of dBFS, which sadly is ambiguous).
What about loudness? One could see loudness as the way us humans measure the amplitude of the sounds that reach our ears. Because the human auditory system is extremely complex, it is not easy to estimate how loud a given signal will be perceived in general. Of the two approaches that I’ve described, RMS is the one that approximates loudness best, but it is still a very crude estimation. Nonetheless, in practice, RMS amplitude is often used as a poor man’s proxy for loudness due to its simplicity. More perceptually accurate ways to estimate loudness would typically involve weighting or even more advanced processes such as those described in ITU-R BS.1770. But that’s a story for another post.